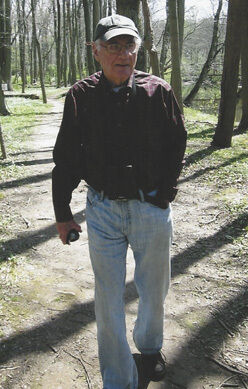
By Ralph Widner
Database catalogues vital statistics for future planning
Retired planner Ralph Widner, a Princeton resident and member of Princeton Future, has spent the last year compiling statistical data about Princeton.
The numbers include demographic, economic, cultural, and geographical information that can be used to help plan for the future of the town of Princeton and the surrounding area.
Widner, who was a featured speaker at the Princeton Future citizens group on Dec. 13, talks about his findings below.
* * *
Where do the 23,000 people work who commute into Princeton every day? Is the traffic increasing every year? How many residents have really low incomes and need our services? How many teens do we have? How many of them are immigrants and don’t speak English very well? How many seniors need help to get around?
After a Princeton Future public forum in 2012 about the need for a comprehensive traffic database to help figure out how to reduce traffic on our streets, a flood of questions like these flooded in from community leaders, civic organizations, and businesses.
“We have to deal with a lot more than land use and transportation issues,” some said. “We have all sorts of human needs. Why not a truly comprehensive community information bank that we can all use as a tool to sharpen our analyses of community needs to help us plan ahead.”
Princeton Future, a group of volunteers dedicated to help protect and enhance our town’s quality of life with research, analysis and public engagement, decided that somebody had to take a crack at developing at least a preliminary framework such an information bank or it might never be created.
By the end of 2014, that effort was far enough along for community service organizations, business groups, our town government and citizens active in civic affairs to take a look and decide whether this initial work provides an adequate starting point for a community database that everyone can access and use and help shape, fine-tune, and update over the years ahead.
In early 2015, this data will be placed on-line so that users can download it in spreadsheet form to adapt for their own purposes. They will also be able to download a reference text, Princeton: A Statistical Portrait that analyzes and interprets the data.
If users want access to specific information before it is on-line, they can e-mail assunpink@gmail.com with specific requests and obtain the spreadsheets or text by e-mail.
Putting the bank to work
Individual civic teams are already putting the tool to work. They are using the data to zero in on such questions as: “Where do our in-commuters work and who are our biggest employers?” “How many drivers really would use expanded transit if it were convenient, reliable, and affordable?” “Can we sort out the commuting patterns on U.S. 1, so that we can design ways to expand transit and get some cars off the highway?” “How can we make sure we have an accurate estimate of residents on low incomes who are not college students?” “How many households own, and how many rent, in each section of town?” “How many households have no car and need help getting around?” “How can we identify the needs of low income Hispanic/Latino residents who are missed by the census in its annual surveys?”
As these teams complete their work, we will release fact sheets and bulletins to keep everybody in the community informed about what they find.
Discoveries about our town so far
Even at this early stage, data from the information bank challenges many common assumptions about our town.
The famous French-Ukrainian geographer Jean Gottman described Princeton in 1961 as “a place with a with a distinct personality” — a “prototype of a brains town.” Another study in 1970 called it an “affluent suburb.” Still another in 2003 described it as a “small dot” in a 1000-square-mile area of office parks and suburban sprawl — “Greater Princeton.” And if you interview residents themselves, perceptions differ, but most agree that Princeton is “different.” The town profile assembled in 2014 from the databank brings out differences most of us might not expect.
Brains town?
Jean Gottman was certainly right when he labeled Princeton a “brains town.” More than a half century later, geographer Enrico Moretti lists the Trenton-Princeton area (really Mercer County) as the 10th ranking metropolitan area in the country in the percentage of its population with a college degree and consequent high salaries for both professionals and those with only a high school degree or less.
Such areas, Moretti argues, are insulated from the ups and downs of the national economy. And he is right. Prices for some houses in Princeton took a nosedive for a time because of that recession. A few jobs were lost.
On the whole, however, as an “education hub,” our area was more or less insulated. Household incomes in Princeton have risen steadily since 1990. In the nation as a whole, those incomes were lower in 2008-2012 than they were in 1990.
Suburb?
It turns out to be a bit deceptive to label Princeton an “affluent suburb.” If we think of a suburb as a place where most residents commute to an out-of-town job each day, Princeton doesn’t meet that definition. Current estimates are that more than half of working residents have jobs in town, compared to only about 20 percent for most New Jersey and American suburbs.
Actually, Princeton ranks 23rd as a New Jersey employment destination. Between 31,000 and 32,000 people work in this small community on a weekday and over 23,000 of them commute in from elsewhere.
Over 26 percent of residents who work in town either walk or bicycle to work compared to 3.5 percent in New Jersey and the U.S.
International
We are an international town. Some 25 percent of our residents were born outside the U.S., a fifth more than for New Jersey, and twice the percentage for the country as a whole.
We really are two towns. About a fifth of the population turns over every year because of the ebb and flow of students, scholars, researchers, and corporate personnel. But 40 percent of householders moved here before 1999 and six percent before 1970. About 25 percent of our homes were built before 1939 compared to about 18 percent in the state and 14 percent in the rest of the country.
Youthful, many seniors
Because college students make up 30 percent of our population, we are a youthful town with a median age of 34, yet our percentage of seniors over age 65 is higher than for New Jersey or the nation.
Our households and families differ significantly from the rest of the state and U.S. In percentage terms, we have more non-family households, more householders living alone, more unmarried couples, more seniors heading households. Though more of our families have children than the state or nation, they have fewer. So our family size is smaller.
Compared to state and national percentages, not as many Princeton women in their 20s and early 30s bear children, but many more between ages 35 and 50 do — and 57 percent of Princeton children were born to mothers with graduate degrees from 2008 through 2012.
Affluent?
We are less “affluent” than “averages” make it appear. While Princeton’s average household incomes are quite high compared to the state and nation, we rank 91st in household income among New Jersey’s municipalities. Princeton’s high “average” is created by very high incomes among the top five percent of its households.
Taking that into consideration, incomes in most of Princeton’s households are comparable to many other adjoining communities.
The gap in incomes between the lowest 20 percent of our households and the top 20 percent is one of the widest in New Jersey. The bottom 20 percent receive only 3.6 percent of the income of the top 20 percent.
About 1,450 individuals in Princeton live below the census-determined poverty threshold, the same number as in 1990, but during 2008-2012 about 26 more families and 70 more seniors lived below the poverty threshold than in 1990.
Diverse?
Though it takes pride in its diversity, only the percentage of Asian residents in Princeton exceeds the proportion in the state or country as a whole.
Its percentages of African-American and Hispanic/Latino residents are lower than the national or state percentages. What is more, the data do not support many common ethnic and racial stereotypes.
The census identified no poor African-American families in Princeton in 2008-2012. Though there were some individual African-Americans with incomes below the poverty threshold, almost two-thirds of African-American families had incomes over $100,000. And African-Americans have the largest percentage of U.S.-born citizens of any group in the community.
Some 62 percent of Princeton’s Hispanic/Latino residents were born in the U.S. or Puerto Rico — and thus are citizens.
Almost a third are college students. Over 30 percent of Hispanic/Latino families have incomes of $100,000 or more. Some high-income families appear to have lived here for a long time.
While just under half of Hispanic/Latino residents live in our central neighborhoods—many here in search of work or family safety and have low incomes—we are uncertain of the number because many are not reached by census surveys, a deficiency we plan to address.
The percentage of foreign-born among Asian residents is the highest for any group. However, half of Asians are here as students. The remaining 1,992 live in 1,100 households, and half of them own their own home. Forty-eight percent have household incomes over $100,000.
White residents who are not Hispanic/Latino account for 56 percent of individuals living below the poverty threshold. They also account for the largest number of foreign-born—about 12.5% of Princeton’s total population.
* * *
These numbers are just a sample of what we learned about our town while we assembled the new database in this first year. A great deal more will be forthcoming in the weeks and months ahead as we put this new civic tool to work. So stay tuned.
Ralph Widner was assistant director of Pennsylvania’s state planning board, and was the first executive director of the 13-state Appalachian Regional Development Program.
He has led numerous local, regional, national, and international projects, including stints overseas for the United Nations, the European Union, and the U.S. State Department.
He moved to Princeton in 2006 to be near his daughter, a professor at Princeton, and considers planning for the region a retirement project to keep himself sharp.
,